I already was planning to write about infographics when I happened to watch a video on Netflix called “Inside: Lego.” Lego’s founding family owns 75 percent of the Danish company.
To illustrate the ownership structure, the program used an infographic, complete with Lego figures representing family patriarch Kjeld Kirk Kristiansen, Denmark’s richest man, and his three children (billionaires all).
Not only did the infographic fit perfectly with the theme of the program, but it truly made the ownership information easier to understand.
Adding oomph to numbers
Infographics are an essential building block of a successful content marketing strategy, helping to relate an ever-growing amount of data in a visually pleasing manner while enhancing comprehension. Websites such as dailyinfographic.com and coolinfographics.com are devoted to the topic.
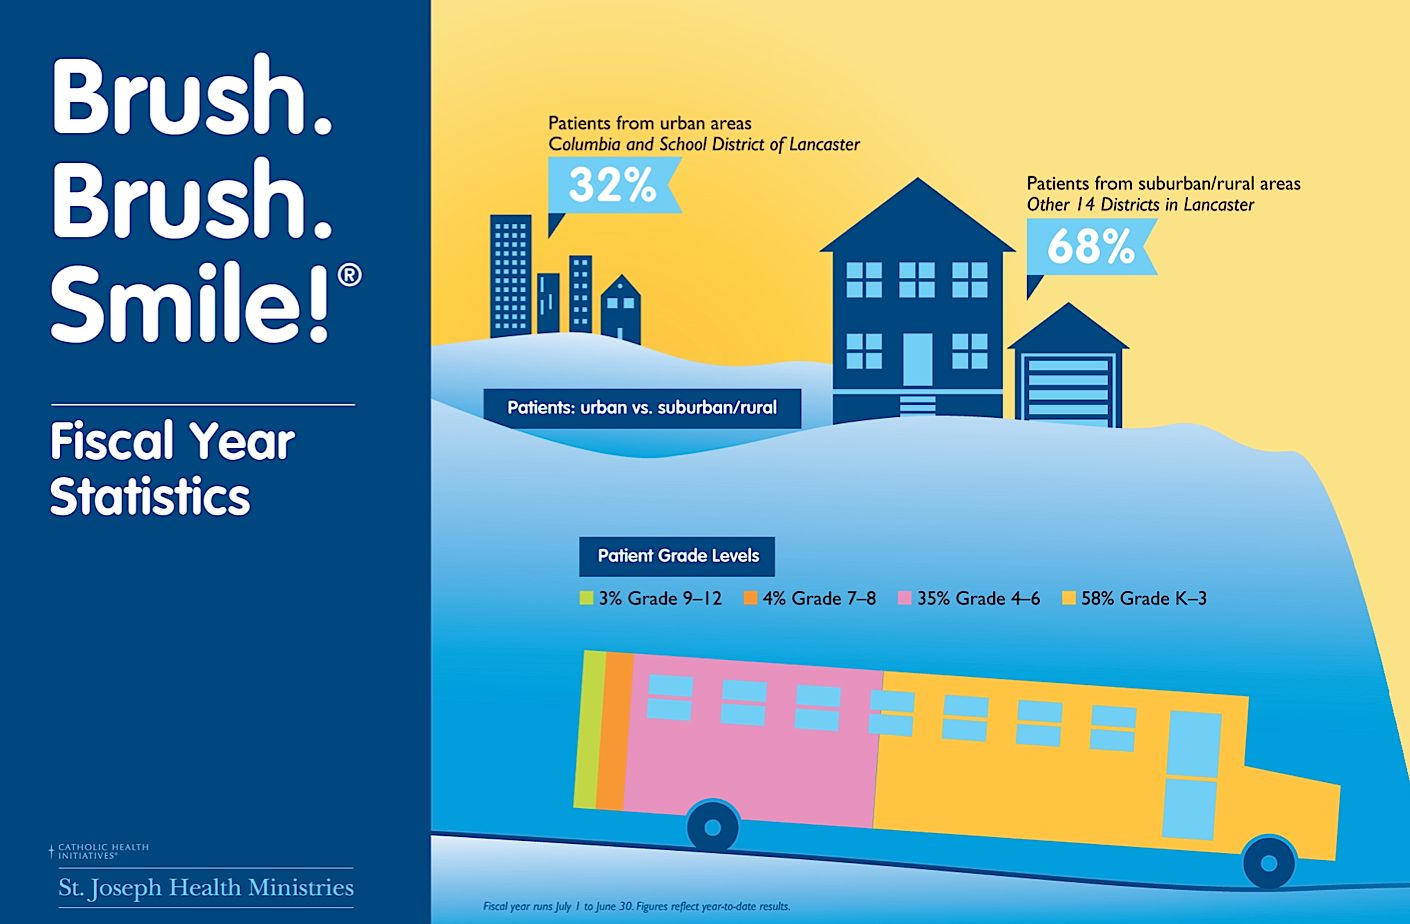
Goulet Communications produced this infographic a while back to give added oomph to year-end numbers for the nonprofit St. Joseph Health Ministries, which provides dental care to economically disadvantaged children in Lancaster County.
A 2013 New Yorker article – “Why Abraham Lincoln Loved Infographics” – by Gareth Cook noted that, “Roughly half of the human brain is involved in processing images.”
Infographics essentially speed that effort by putting information in an easier-to-understand format. Cook placed the first infographic in 1786. He noted that President Lincoln in 1861 “became obsessed” with what he called his “slave map.”
With the use of shading, the map showed areas of heavy slavery but also areas where slavery was lighter and potentially pro-Union.
“Surely what Lincoln found appealing about his slave map was the way it made a bit of sense of the world,” Cook wrote.
Infographics became an increasingly important part of daily newspapers, my former world, after USA Today debuted in 1982. Some purists lambasted USA Today for oversimplifying topics visually, but there’s no denying the newspaper’s influence on the rest of the newspaper industry.
At the York Daily Record, I and other reporters worked closely with graphic artists to make our stories more compelling and easier to understand through the use of maps, charts, illustrations.
‘Information arms race’
Infographics are a powerful tool amid what Cook described as an “escalating information arms race. Data has become ‘big.’ ”
Just think about how photos and infographics draw your attention on Facebook and Twitter. Look at the popularity of Instagram and Pinterest.
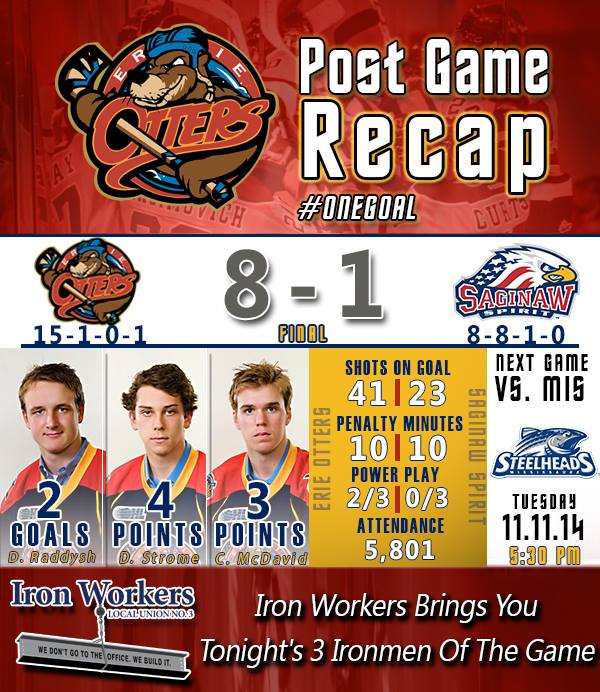
I’m a big hockey fan, and I love the way the Erie Otters use infographics to summarize periods and games on Facebook:
Jason Miller of LinkedIn, writing on the Content Marketing Institute website, noted that a blog is the best “permanent residence” for an infographic but recommended including an embed code.
“Great infographics have wanderlust – they beg to travel and be consumed; that’s why you find them all over the web.”
Unlike Lincoln, most of us aren’t trying to hold a nation together. We’re just trying to tell compelling stories.
Words are one way, photos are another, and infographics – combining words and images – are yet another.
Like Lincoln, we’re all trying to make sense of the world.